
티스토리 뷰
filebeat + Logstash + aws S3 설정

삭제 로그 수집을 위한 Logstash.
Logstash는 입출력 도구로서, 다양한 종류의 로그 (System logs, webserver log. error log, application log) 등 다양한 종류의 로그를 가공하여 저장하거나 출력할 수 있다.
실시간 로그 처리 용도로도 가능하다.
> 테스트 환경
현재 개발서버에 올라와있는 Schedule server와 Logstash Indexer 서버는 t2.micro 다.
> 구성도
위 그림에서 설명하듯 log 파일이 떨어지는 곳에 log를 읽고 보낼 수 있는 filebeat을 설치한다.
filebeat 소개 페이지에서 설명하듯 `경량 로그 수집기`라고 적혀 있다.
이유는 뭐, application이 돌고 있는 로그 수집기가 자원을 많이 먹거나 하면 안되니까?
ubuntu 에서 package로 설치하기 앞서 아래 명령어를 수행한다.
APT
Download and install the Public Signing Key:
wget -qO - https://artifacts.elastic.co/GPG-KEY-elasticsearch | sudo apt-key add -
You may need to install the apt-transport-https package on Debian before proceeding:
sudo apt-get install apt-transport-https
Save the repository definition to /etc/apt/sources.list.d/elastic-5.x.list:
echo "deb https://artifacts.elastic.co/packages/5.x/apt stable main" | sudo tee -a /etc/apt/sources.list.d/elastic-5.x.list
sudo apt-get update & sudo apt-get install filebeat
명령어로 filebeat을 설치한다.
설정 경로는 다음과 같다.
/etc/filebeat/filebeat.yml
설정 파일 내용
###################### Filebeat Configuration Example #########################

# This file is an example configuration file highlighting only the most common
# options. The filebeat.full.yml file from the same directory contains all the
# supported options with more comments. You can use it as a reference.
#
# You can find the full configuration reference here:
# https://www.elastic.co/guide/en/beats/filebeat/index.html

#=========================== Filebeat prospectors =============================

filebeat.prospectors:

# Each - is a prospector. Most options can be set at the prospector level, so
# you can use different prospectors for various configurations.
# Below are the prospector specific configurations.

- input_type: log

  # Paths that should be crawled and fetched. Glob based paths.
  paths:
    - /schedule_server/log/schedule-server-delete-mail.log
    #- c:\programdata\elasticsearch\logs\*

  # Exclude lines. A list of regular expressions to match. It drops the lines that are
  # matching any regular expression from the list.
  #exclude_lines: ["^DBG"]

  # Include lines. A list of regular expressions to match. It exports the lines that are
  # matching any regular expression from the list.
  #include_lines: ["^ERR", "^WARN"]

  # Exclude files. A list of regular expressions to match. Filebeat drops the files that
  # are matching any regular expression from the list. By default, no files are dropped.
  #exclude_files: [".gz$"]

  # Optional additional fields. These field can be freely picked
  # to add additional information to the crawled log files for filtering
  #fields:
  #  level: debug
  #  review: 1

  ### Multiline options

  # Mutiline can be used for log messages spanning multiple lines. This is common
  # for Java Stack Traces or C-Line Continuation

  # The regexp Pattern that has to be matched. The example pattern matches all lines starting with [
  #multiline.pattern: (?s).*[\n\r].*
  #mulitline.pattern: 'contents='

  # Defines if the pattern set under pattern should be negated or not. Default is false.
  # multiline.negate: true

  # Match can be set to "after" or "before". It is used to define if lines should be append to a pattern
  # that was (not) matched before or after or as long as a pattern is not matched based on negate.
  # Note: After is the equivalent to previous and before is the equivalent to to next in Logstash
 # multiline.match: after


#================================ General =========

# The name of the shipper that publishes the network data. It can be used to group
# all the transactions sent by a single shipper in the web interface.
#name:

# The tags of the shipper are included in their own field with each
# transaction published.
#tags: ["service-X", "web-tier"]

# Optional fields that you can specify to add additional information to the
# output.
#fields:
#  env: staging

#================================ Outputs =====================================

# Configure what outputs to use when sending the data collected by the beat.
# Multiple outputs may be used.

#-------------------------- Elasticsearch output ------------------------------
#output.elasticsearch:
  # Array of hosts to connect to.
#  hosts: ["localhost:9200"]

  # Optional protocol and basic auth credentials.
  #protocol: "https"
  #username: "elastic"
  #password: "changeme"

#----------------------------- Logstash output --------------------------------
output.logstash:
  # The Logstash hosts
  hosts: ["ip:port"]

  # Optional SSL. By default is off.
  # List of root certificates for HTTPS server verifications
  #ssl.certificate_authorities: ["/etc/pki/root/ca.pem"]

  # Certificate for SSL client authentication
  #ssl.certificate: "/etc/pki/client/cert.pem"

  # Client Certificate Key
  #ssl.key: "/etc/pki/client/cert.key"

#================================ Logging =====================================

# Sets log level. The default log level is info.
# Available log levels are: critical, error, warning, info, debug
#logging.level: debug

# At debug level, you can selectively enable logging only for some components.
# To enable all selectors use ["*"]. Examples of other selectors are "beat",
# "publish", "service".
#logging.selectors: ["*"]
Logstash output에 정의된 host:port를 정의하고 진행하면 된다.
그 밖의 설정은 홈페이지를 참조하라.
filebeat은 설정 파일에 저장된 log를 읽은 뒤 라인 수 등 정보를 저장한다.
위치는 /var/lib/filebeat/ 경로로 registry 라는 파일 명으로 기록한다.
따라서, 다시 한번 로그를 읽기 위해서는 다음과 같이 수행하면 된다.
root@ip-172-30-54-193:/etc/filebeat/filebeat# service filebeat stop
root@ip-172-30-54-193:/etc/filebeat/filebeat# rm registry
root@ip-172-30-54-193:/etc/filebeat/filebeat# service filebeat start
Logstash 설정
# The # character at the beginning of a line indicates a comment. Use
# comments to describe your configuration.
input {
 beats {
  port => 5044
 }
}
# The filter part of this file is commented out to indicate that it is
# optional.
 filter {
  grok {
          patterns_dir => ["./patterns"]
          match => {"message" => "%{Mypattern:info}"}
          remove_field => ["@timestamp" , "offset", "@version", "input_type", "beat", "host", "source", "type", "message" ]
        }
}

output {
#  stdout { codec => rubydebug }
 # file {
 #    codec => rubydebug
 #    path => "/파일 저장 위치"
 # }
  s3 {
    access_key_id => "aws id"
    secret_access_key => "aws secret key"
    bucket => "bucket name"
    codec => rubydebug
    region => "ap-northeast-2"

  }
}
현재 Logstash는 별도의 서버에 올려 놓은 상태다.
설정부분은 매우 간략하고 보기 편하다.
위 동영상에서 말하듯 수많은 플러그인이 이미 내장되거나 지원되기 때문에 많은 이점이 있다.
grok 같은 경우는 앞서 정리해놓은 문서를 확인하자.
응용방법 링크를 통해 확인하면된다.
현재 구성한 방법은
application server (filebeat) ->indexer(logstash) -> S3 다.
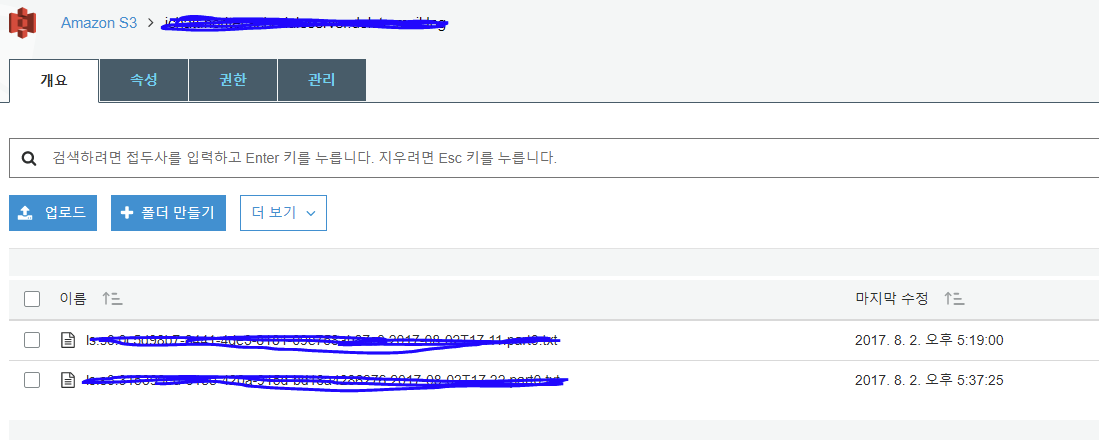
정상적으로 구성이 되었다면 아래와 같이 S3에 파일이 쌓이는 것을 확인 할 수 있다.
현재 링크 에서 확인해보았지만 파일 이름을 다루는 내용들은 없는 것 같았다.
만약, 방법을 찾는다면 원하는 파일 명으로 저장하도록 설정하자.
'Study > Log stash' 카테고리의 다른 글
| LOG Stash 시작. (0) | 2017.08.01 |
|---|
- Total
- Today
- Yesterday
- jstl 커스텀 태그
- jstl split
- POE Excel 만들기
- java 특정문자 갯수구하기
- coroutine
- java 설정
- java 설치
- 전자정부프레임워크 tiles
- github image 첨부시 주의할점
- 코루틴
- POI EXCEL
- java 폴더구조 구하기
- Database#transaction
- spring property
- Kotlin
- jstl foreach
- java 압축 풀기
- MyBatis 팁
- JSP 세션
- spring ExcelView
- mybatis Merge
- JSTL
- java calendar
| 일 | 월 | 화 | 수 | 목 | 금 | 토 |
|---|---|---|---|---|---|---|
| 1 | ||||||
| 2 | 3 | 4 | 5 | 6 | 7 | 8 |
| 9 | 10 | 11 | 12 | 13 | 14 | 15 |
| 16 | 17 | 18 | 19 | 20 | 21 | 22 |
| 23 | 24 | 25 | 26 | 27 | 28 | 29 |
| 30 |